Reporting

Your whole firm, on one screen, built for you.

Most firms get their numbers in five different logins, and none of them agree. Scout Recon puts your traffic, calls, leads, and signed cases in one place, built for your firm on your own data, so there is one set of numbers everyone trusts.

The problem

Five logins, five different answers.

Your ads are in one tool, your calls in another, your website in a third, your cases in your case system. Nothing connects, the totals never match, and you are left stitching it together yourself. A report is only useful if you can trust it, and you cannot trust five reports that disagree.

What it does

One source of truth, built around your firm.

Custom-built

Built for you, not off a template

Your dashboard is built by us, for your firm. We start from what you actually need to see and build the views around it, not the other way around.

First-party data

Your own numbers, not estimates

It runs on your firm's own first-party data, the real numbers from your site, calls, and cases, so what you see is yours, not a sampled estimate from someone else's tool.

Adaptable

Changes as your firm changes

No two firms are the same, so no two dashboards are the same. When your practice areas, channels, or questions change, the reporting changes with you.

The difference

We built our own reporting. We don't rent it.

This isn't Looker Studio or an off-the-shelf dashboard with your logo dropped on top. We built and host the reporting ourselves, so we can shape it to your firm, add the views you ask for, and keep it honest. You own your data, we own the build, and you get reporting that fits your firm instead of forcing your firm to fit the tool.

The proof

Sign-ups and case mix, every lead tracked to its source.

Your overview ties it together: how many cases you signed, which channels and case types are driving them, and how your digital share is trending. From there you drill into attribution, calls, AI search, and matters, without switching tools.
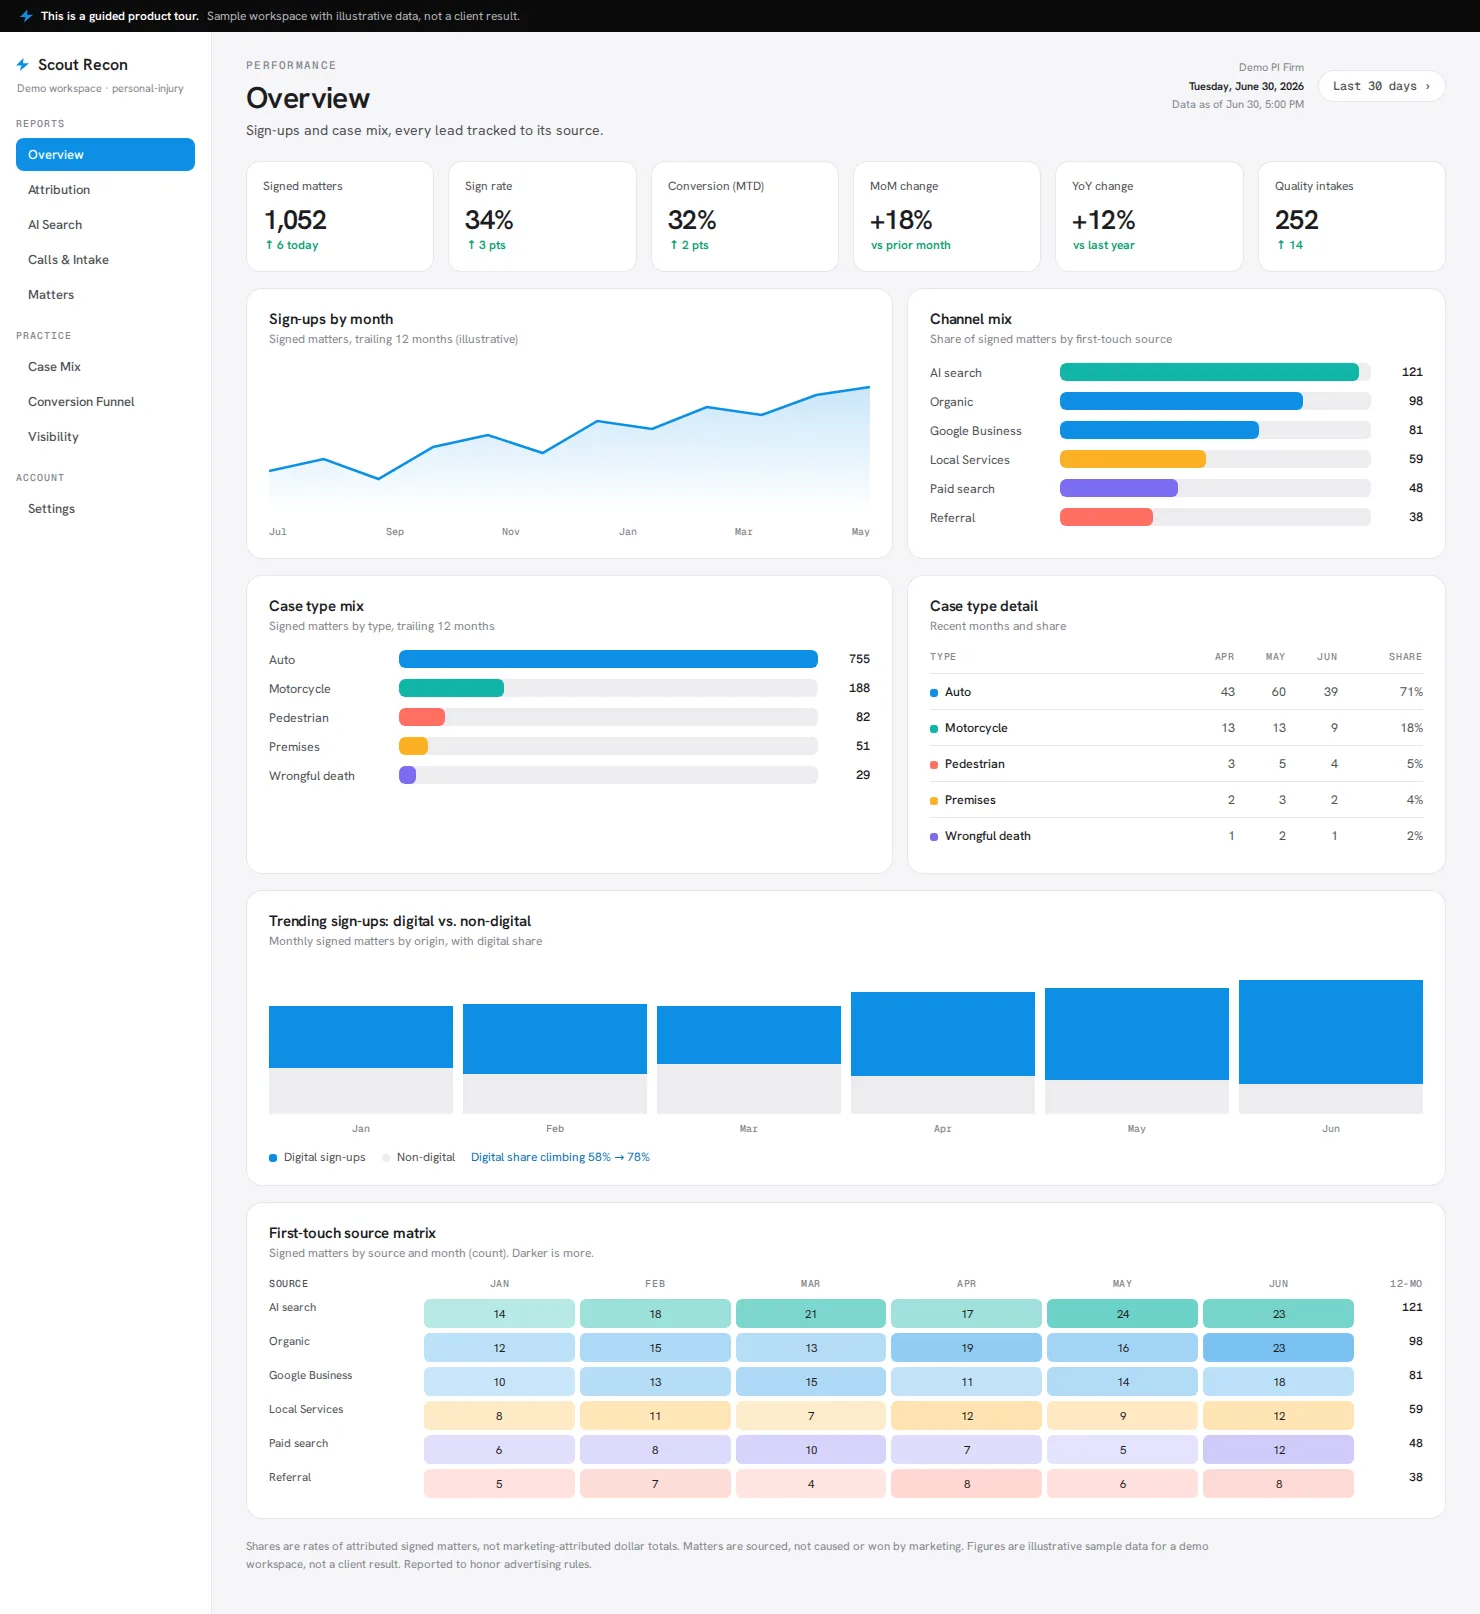
Scout Recon overview dashboard, a sample workspace with illustrative data, showing signed matters, sign rate, channel mix, case-type mix, digital-versus-non-digital trend, and a first-touch source matrix, all on one screen
Sample workspace · overview · every lead tracked to its source

Sample workspace with illustrative data, not a client result. Figures are sourced, not caused or won by marketing.

The honest part

We tell you when we don't know.

If a data feed stalls, the dashboard withholds that number instead of showing you a stale one, and it flags itself the moment it happens. We report in rates and proportions, your case mix, your source breakdown, your sign rate, never dollar promises. You would rather see a dash than a wrong number, and so would we.

See how reporting connects to the whole system ›

ONE SOURCE OF TRUTHBUILT FOR YOUR FIRMYOUR OWN DATAONE SOURCE OF TRUTHBUILT FOR YOUR FIRMYOUR OWN DATA

Stop reconciling five reports. Get one you trust.

See it on your own numbers.

Book a demo